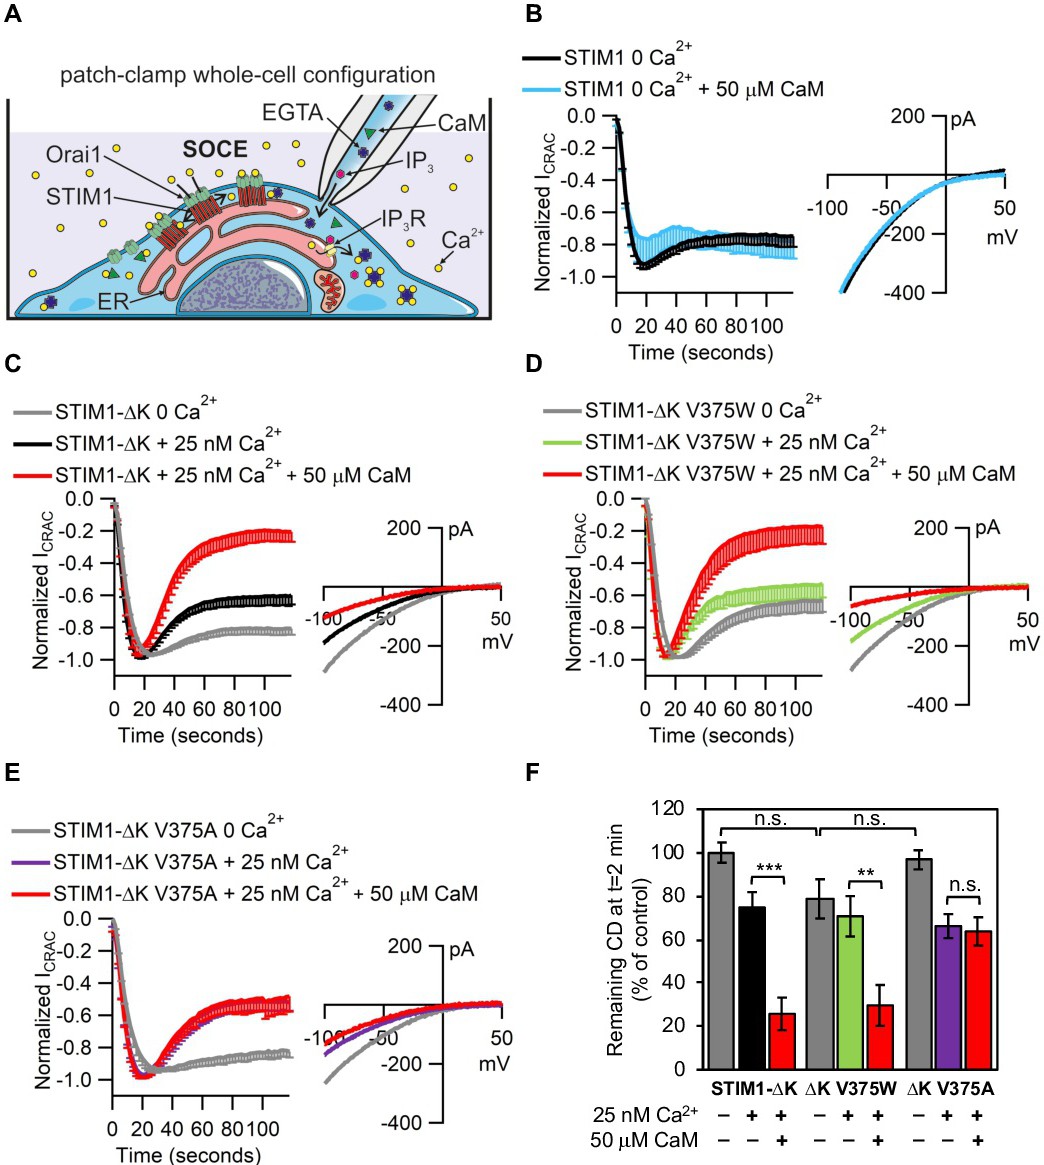
Fig. 5. Val375 of STIM1 is a critical for Ca2+/CaM-mediated SCDI of ICRAC. (A), Cartoon illustrating the patch-clamp electrophysiology experimental setup. (B), average normalized current density (CD) of the ICRAC recordings (STIM1 0 [Ca2+]i, n = 10; STIM1 0 [Ca2+]i + 50 mM CaM, n = 5; mean - SEM) from HEKO1 STIM1-/- cells and average current-voltage (I-V) curves of the ICRAC recordings at t = 2 min. (C), average normalized current density (CD) of the ICRAC recordings (STIM1-∆K + 0 [Ca2+]i, n = 15; STIM1-∆K + 25 nM [Ca2+]i, n = 11; STIM1-∆K + 25 nM [Ca2+]i + 50 µM CaM, n = 8; mean - SEM) from HEKO1 STIM1-/- cells and average I-V curves of the ICRAC recordings at t = 2 min. (D), average normalized current density (CD) of the ICRAC recordings (STIM1-∆K V375W + 0 [Ca2+]i, n = 6; STIM1-∆K V375W + 25 nM [Ca2+]i, n = 6; STIM1-∆K V375W + 25 nM [Ca2+]i + 50 µM CaM, n = 8; mean - SEM) from HEKO1 STIM1-/- cells and average I-V curves of the ICRAC recordings at t = 2 min. (E), average normalized current density (CD) of the ICRAC recordings (STIM1-∆K V375A + 0 [Ca2+]i, n = 8; STIM1-∆K V375A + 25 nM [Ca2+]i, n = 9; STIM1-∆K V375A + 25 nM [Ca2+]i + 50 µM CaM, n = 9; mean - SEM) from HEKO1 STIM1-/- cells and average I-V curves of the ICRAC recordings at t = 2 min. (F), average of the remaining CD at t = 2 min from individual traces shown in C, D and E (mean ± SEM). The average of the remaining CD at t = 2 min of STIM1-∆K with 0 [Ca2+]i was set to 100 for normalization. Addition of either 25 nM [Ca2+]i alone or together with 50 µM CaM is indicated below the bar graphs. p value (p) of each of the CaM added condition compared to its respective without CaM condition is indicated as non-significant (n.s.) for p > 0.05 or "**" for p ≤ 0.01 or "***" for p ≤ 0.001.